

Type 2 diabetes is a chronic condition affecting millions of Americans, characterized by insulin resistance or insufficient insulin production, leading to elevated blood glucose levels. As the most common form of diabetes, it accounts for 90-95% of all diabetes cases in the United States. This article explores the latest U.S. government data, providing detailed insights into prevalence, incidence, complications, and economic costs associated with Type 2 diabetes, supported by tables and charts.
Understanding Type 2 Diabetes:
Type 2 diabetes occurs when the body cannot effectively use insulin, a hormone that regulates blood sugar. Over time, high blood glucose levels can damage organs, leading to serious complications such as heart disease, kidney failure, and vision loss. Risk factors include obesity, physical inactivity, family history, and certain ethnic backgrounds. Unlike Type 1 diabetes, Type 2 is largely preventable through lifestyle changes like healthy eating, regular exercise, and weight management.
Prevalence of Type 2 Diabetes in the U.S.
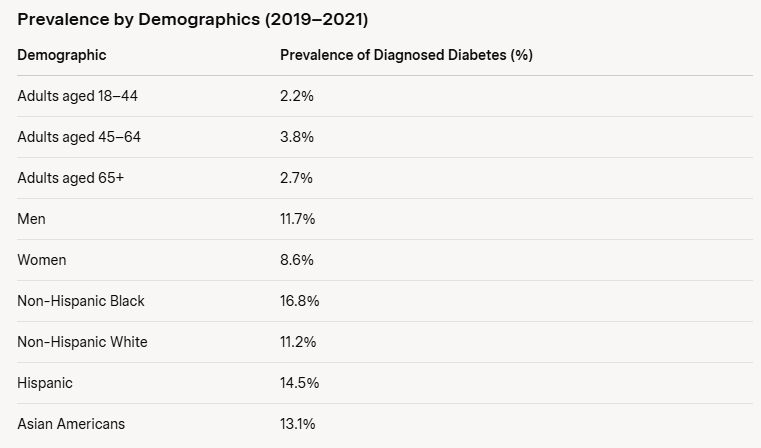
According to the Centers for Disease Control and Prevention (CDC), approximately 38.4 million Americans (11.6% of the population) had diabetes in 2021, with Type 2 diabetes comprising the vast majority. Of these, 29.7 million were diagnosed, while 8.7 million remained undiagnosed. The prevalence is higher among older adults, men, and certain racial/ethnic groups.
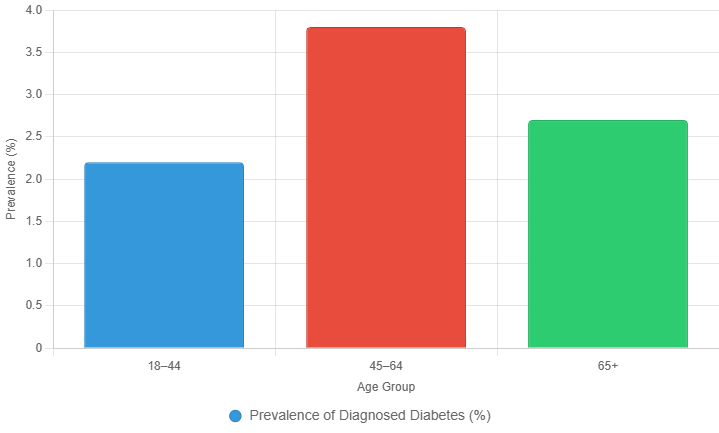
The chart below illustrates the prevalence of diagnosed diabetes across age groups:
Incidence of Type 2 Diabetes:
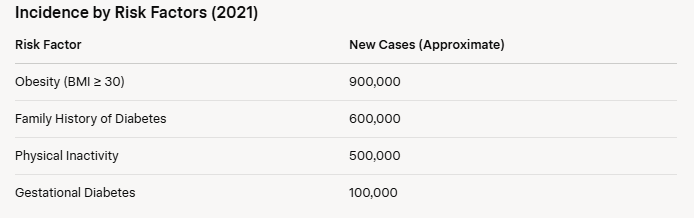
The incidence of new Type 2 diabetes cases has been steadily increasing. In 2021, the CDC reported approximately 1.4 million new cases among adults aged 18 and older. The incidence rate is higher among certain populations, particularly those with lower socioeconomic status and limited access to healthcare.
Complications Associated with Type 2 Diabetes
Type 2 diabetes can lead to severe health complications if not managed properly. According to the National Institute of Diabetes and Digestive and Kidney Diseases (NIDDK), common complications include:
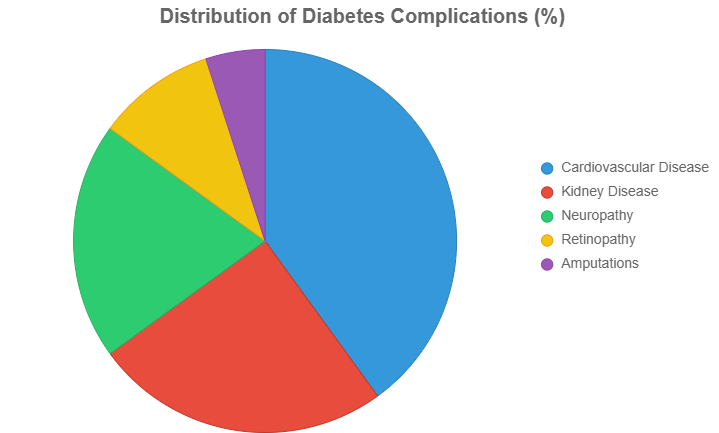
- Cardiovascular Disease: Diabetes doubles the risk of heart disease and stroke. In 2020, approximately 1.5 million hospitalizations were linked to diabetes-related cardiovascular issues.
- Kidney Disease: Diabetes is the leading cause of kidney failure, with 44% of new cases in 2021 attributed to diabetes.
- Neuropathy: Over 50% of diabetic patients develop nerve damage, leading to numbness or pain, particularly in the extremities.
- Retinopathy: Diabetes is a leading cause of blindness, affecting approximately 7.7 million adults in the U.S.
- Amputations: In 2020, about 130,000 lower-limb amputations were performed due to diabetes-related complications.
The chart below shows the distribution of major complications:
Economic Impact of Type 2 Diabetes:
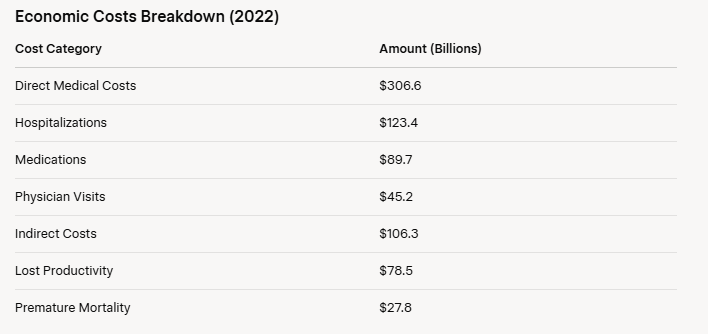
The economic burden of Type 2 diabetes is substantial. According to the American Diabetes Association (ADA), the total cost of diagnosed diabetes in 2022 was $412.9 billion, including $306.6 billion in direct medical costs and $106.3 billion in indirect costs (e.g., lost productivity).
Management and Prevention Strategies:
The CDC and other government agencies emphasize prevention and management to reduce the burden of Type 2 diabetes. Key strategies include:
- Lifestyle Interventions: Programs like the CDC’s National Diabetes Prevention Program promote weight loss, healthy eating, and physical activity, reducing the risk of developing Type 2 diabetes by up to 58%.
- Access to Healthcare: Early diagnosis and treatment, including regular blood glucose monitoring and medications like metformin, can prevent complications.
- Public Health Campaigns: Initiatives like “Do I Have Prediabetes?” aim to raise awareness about prediabetes, which affects 96 million U.S. adults, many of whom are unaware.
Disparities in Diabetes Care:
Health disparities significantly impact Type 2 diabetes outcomes. Non-Hispanic Black, Hispanic, and Native American populations face higher rates of diabetes and complications due to systemic barriers like limited healthcare access and socioeconomic challenges. For example, Native Americans have the highest diabetes prevalence at 18.7%.
Conclusion:
Type 2 diabetes remains a significant public health challenge in the U.S., with millions affected and substantial economic costs. U.S. government data highlights the need for targeted interventions to address prevalence, reduce complications, and mitigate disparities. By leveraging lifestyle changes, early diagnosis, and public health initiatives, the burden of Type 2 diabetes can be reduced. For more information, visit the CDC’s diabetes resources at www.cdc.gov/diabetes or explore the ADA’s cost data at www.diabetes.org.
Note: Data is sourced from the CDC’s 2021 National Diabetes Statistics Report, NIDDK, and ADA’s 2022 Economic Costs of Diabetes. For real-time updates, check www.cdc.gov or recent posts on X.